Your Real-Time Command Center
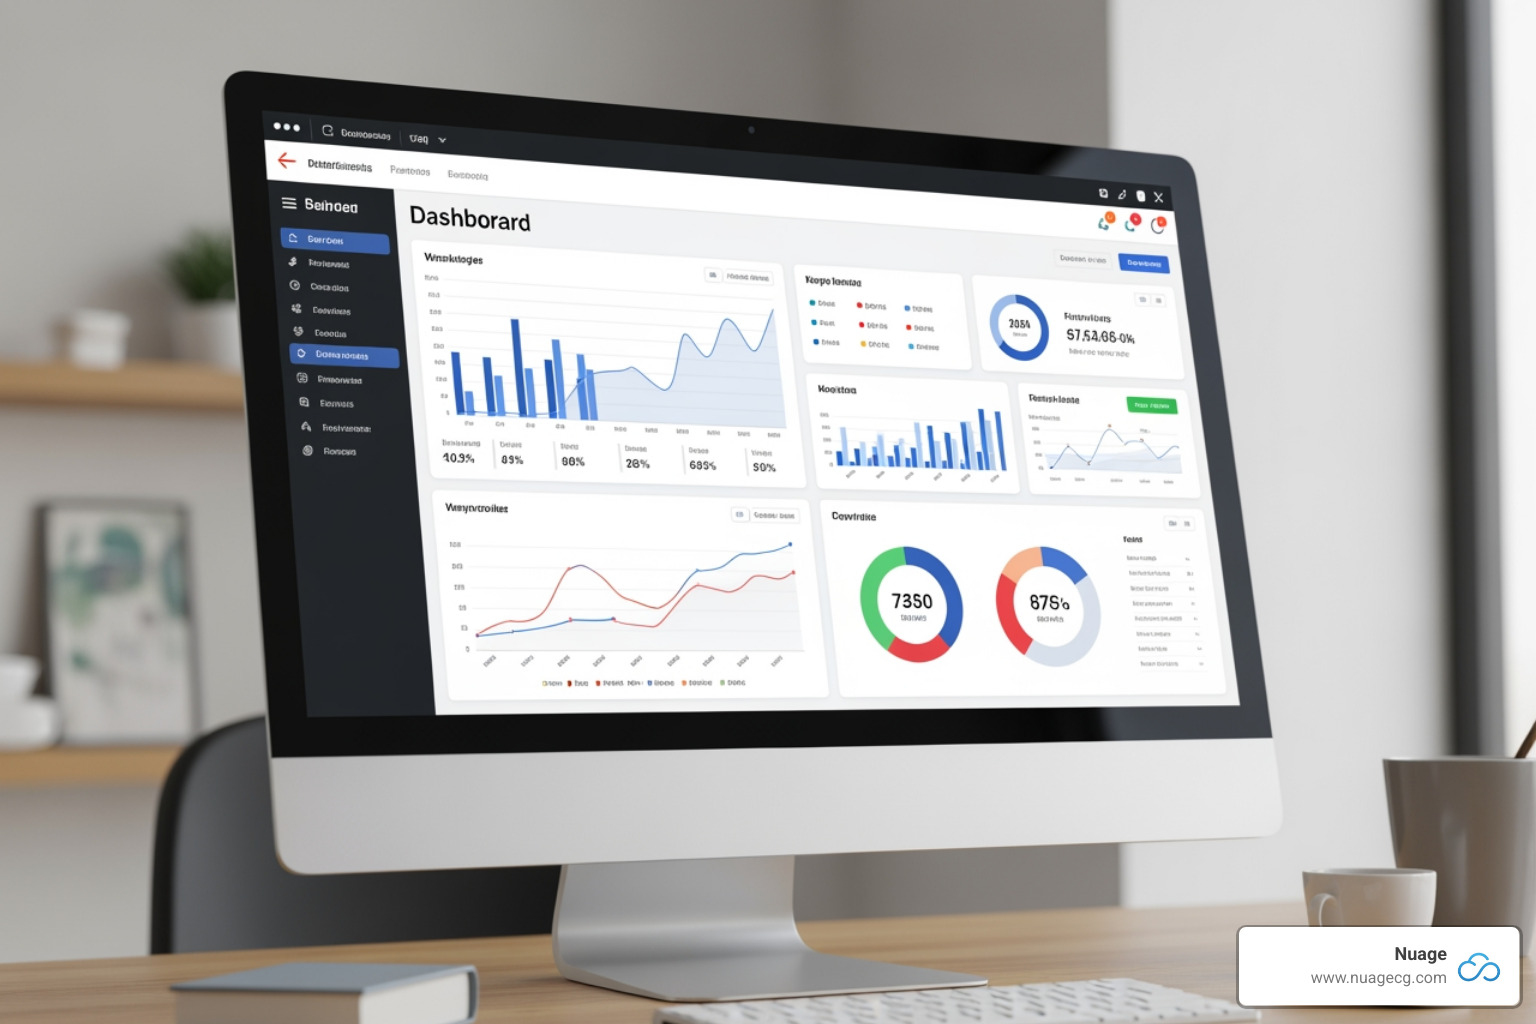
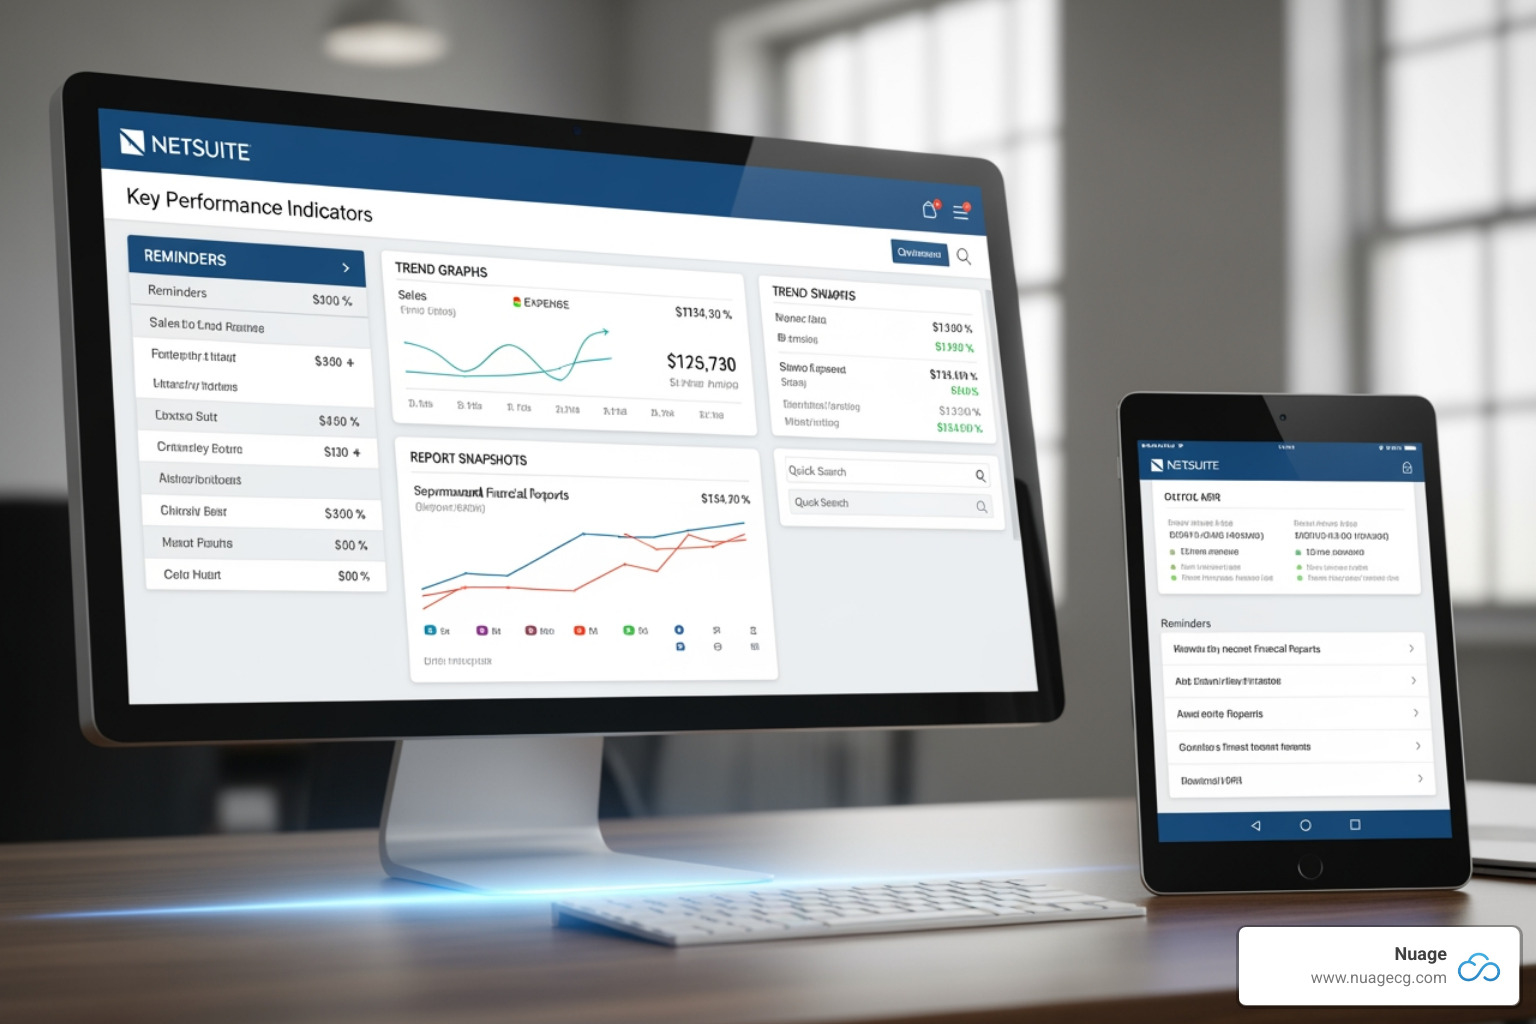
NetSuite dashboards are customizable, role-based workspaces that display real-time business data in a single, consolidated screen. Using dynamic windows called portlets, they show KPIs, reports, and analytics from across your ERP, enabling faster decisions without hunting through menus or relying on IT.
Key Features of NetSuite Dashboards:
- Portlets: Modular widgets for KPIs, saved searches, graphs, and reminders.
- Role-Based Views: Data is custom to each user’s job function (Sales, Finance, etc.).
- Real-Time Data: Information updates automatically from the NetSuite database.
- Customizable Layouts: Drag-and-drop interface with multiple layout options.
- Drill-Down Capability: Click from summary metrics to transaction-level details.
- SuiteAnalytics Integration: Connect to workbooks, pivot tables, and BI tools.
While dashboards are increasingly critical business drivers, many companies struggle to use them effectively. A 2023 Forrester survey found that 46% of respondents didn’t know how to find their company’s data reports and insights. This gap is what we address at Nuage. Most businesses only use about 20% of NetSuite’s potential, with dashboards being a prime example of an underused feature.
At Nuage, we help organizations get more from their NetSuite investment by designing role-based dashboards that drive adoption and decision-making.
Understanding the Core Components of NetSuite Dashboards
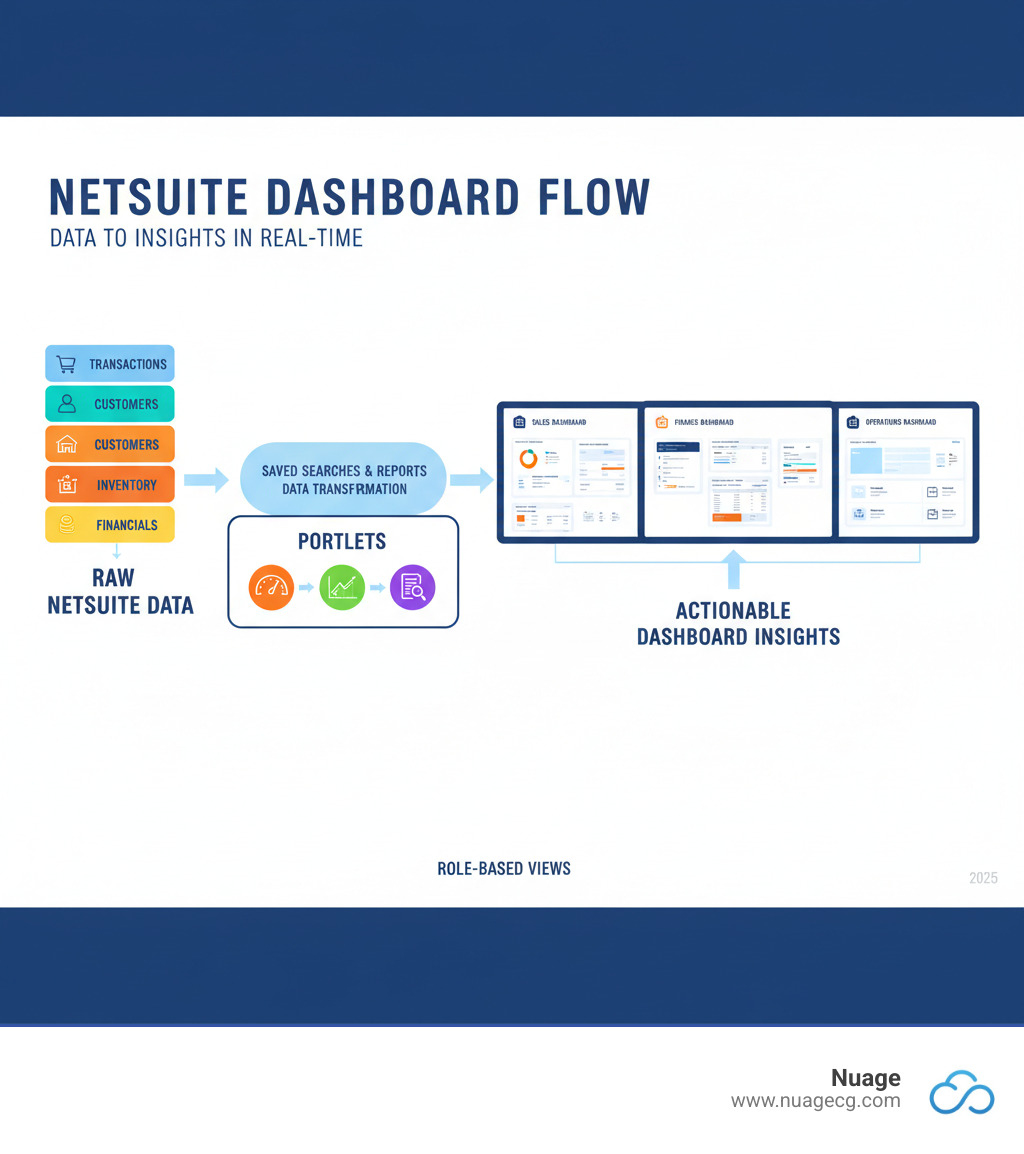
A NetSuite dashboard works by combining several key components to transform raw data into actionable intelligence. Understanding these building blocks is the first step to mastering your dashboard.
Portlets: The Building Blocks of Your Dashboard
When you log into NetSuite, your home page is a collection of portlets—dynamic data windows that display real-time business information. They are highly flexible and can be rearranged, minimized, or expanded.
Common portlets include:
- Reminders Portlet: Keeps critical tasks front and center, like bills to approve or overdue invoices.
- Shortcuts Portlet: Puts your most-used pages right at your fingertips.
- KPI Meter: Provides a quick visual gauge of performance against targets.
- Report Snapshots: Displays charts and graphs from key reports to spot trends.
- Analytics Portlet: Lets you embed charts and pivot tables from SuiteAnalytics Workbooks.
- Settings Portlet: Your control panel for managing preferences and customizing your layout.
For more technical details, see the NetSuite documentation on dashboard portlets. Our guide on Netsuite Custom Reports can also help you create reports that feed these portlets.
KPIs and Saved Searches: The Engine of Your Data
If portlets are the display, Key Performance Indicators (KPIs) and Saved Searches are the engines generating the data. KPIs are the critical metrics that tell you how your business is performing. NetSuite includes over 75 pre-built KPIs, but you can also create custom KPIs custom to your specific goals, such as “Average Days to Pay” or “Customer Lifetime Value.”
Behind many KPIs and portlets are Saved Searches. These are customizable queries that extract specific information from your database without any coding. For example, a saved search can identify all overdue invoices or inventory items below their reorder point. As NetSuite explains, this is about getting precise results that fit key criteria. They are the foundation for custom KPIs, reminders, and complex reports. Learn more with our guide on How to Make a Report in NetSuite.
SuiteAnalytics Integration: Taking Analysis Further
SuiteAnalytics, NetSuite’s embedded business intelligence solution, lifts your dashboards from simple displays to powerful analytical tools.

The SuiteAnalytics Workbook allows you to create interactive charts and pivot tables for deeper data exploration. You can build a chart showing sales trends by region or analyze profitability by product line, all within NetSuite. The platform is even incorporating generative AI to create reports from natural language queries.
For integrating with external systems, SuiteAnalytics Connect provides JDBC, ODBC, and ADO.NET drivers to link with third-party BI tools or data warehouses. Because SuiteAnalytics is embedded, your analytics are always real-time and directly connected to your operational data, ensuring accuracy and confidence in your decisions.
For a deeper dive, explore our guide on Suite Analytics or the official NetSuite SuiteAnalytics Reporting & Dashboards page. Our guide on Suite Analytics Connect also covers external data integration.
How to Customize and Personalize Your Dashboard
One of the most powerful aspects of NetSuite dashboards is their flexibility. They are designed to adapt to your specific role and workflow, and learning to customize them is easier than you might think.
Personalizing Your View for Maximum Efficiency
Your NetSuite dashboard should be your personal mission control, and you can configure it in minutes without IT help.
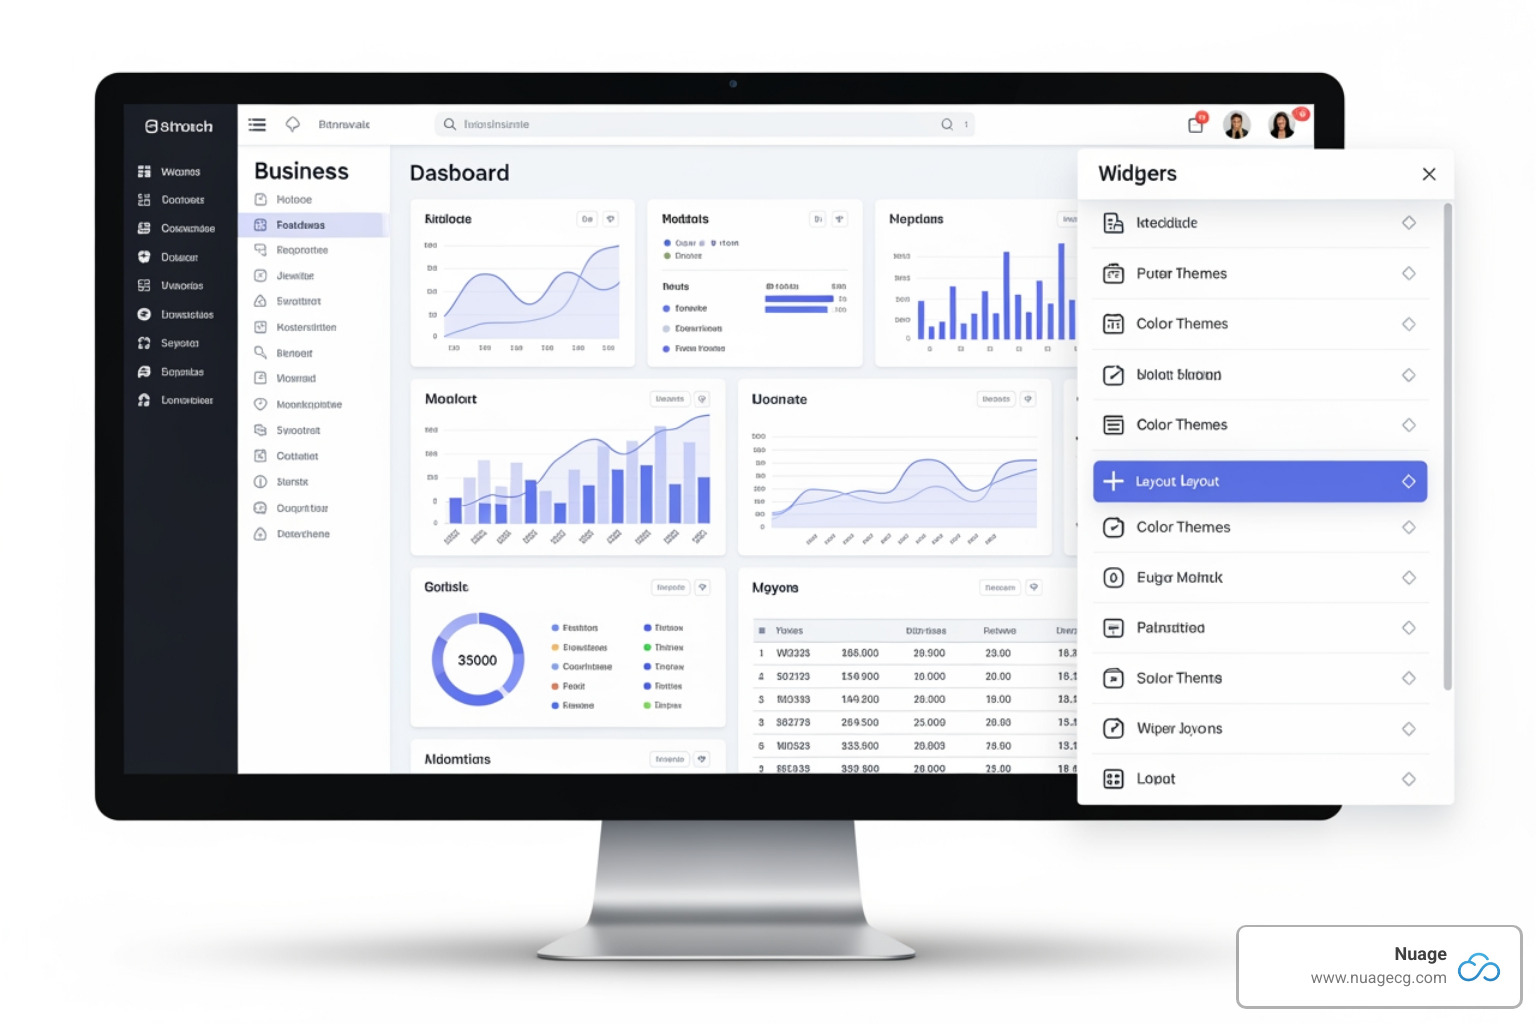
To start, click the “Personalize” button in the top right corner of your home dashboard. A panel will appear with available portlets; simply click to add them. Once on your screen, use the drag-and-drop functionality to arrange them as you see fit.
Each portlet has a “Set Up” link or menu icon that lets you configure its specific content. For a KPI portlet, you can choose which metrics to show and set date ranges. For a reminders portlet, you can select which reminders are most important to you. NetSuite also offers various dashboard layout options (one, two, or three columns) to help you organize information for maximum visibility.
This personalization ensures your dashboard cuts through the noise, presenting only the most relevant information for your role. It’s about working smarter, not harder, a key benefit explored in our article on What are the many benefits of customizing Netsuite?.
Publishing Custom NetSuite Dashboards for Your Team
Administrators can take efficiency a step further by publishing standardized dashboards to specific roles or user groups. This transforms individual productivity into organizational excellence.
Instead of new employees configuring their own workspace, they can log in on day one to a curated dashboard with everything they need. This creates consistency across the organization, ensuring everyone in a role sees the same critical information and uses the same tools. It also helps users focus on what matters for their role.
Administrators can even “lock” published dashboards to maintain control over the user interface for compliance or to prevent accidental changes. To do this, an administrator with the “Publish Dashboards” role permission configures a dashboard and then uses the Settings portlet to click “Publish Dashboard.” From there, they can name the dashboard, select target roles, and choose whether to lock it.
This function turns NetSuite dashboards into organizational assets that drive consistency and efficiency. For a detailed walkthrough, see NetSuite’s Guide to Publishing Dashboards. This is a valuable aspect of Netsuite ERP Customization.
The Business Impact: Benefits and Problems Solved
NetSuite dashboards aren’t just for aesthetics; they solve real problems that cost businesses time and money.
Gaining Unprecedented Visibility and Insight
The power of a real-time, 360-degree view of your business cannot be overstated. When your sales team in Manhattan Beach and your warehouse team in Jacksonville see the same data simultaneously, data silos disappear. Fragmented spreadsheets are replaced by a single, unified view everyone trusts.
Data trust is a major issue for many companies. Because NetSuite dashboards connect directly to the underlying ERP modules, they eliminate discrepancies. The number you see is the same number your colleague sees, pulled from the same source in real-time. This visibility allows an accounts receivable manager to spot payment trends, a purchasing director to see dropping inventory levels, and a CFO to monitor financial KPIs without waiting for month-end close. This proactive insight is how Inventory Dashboards Make Business Profitable.
Accelerating Decision-Making and Improving Performance
The ultimate goal of a business intelligence tool is to help you make better decisions faster. With real-time KPIs on your dashboard, you can see the pulse of your business as it happens. The drill-down capability means you’re never more than a few clicks from the detailed information needed to make an informed decision.
This immediate access, demonstrated in this NetSuite Dashboard Overview (Video), shifts management from reactive to proactive. You can investigate payment abnormalities or adjust a sales strategy this week, not next quarter.
Productivity increases as teams spend less time hunting for information and more time acting on it. Reminders, shortcuts, and KPI meters all contribute to a more efficient workforce. When dashboards are intuitive and valuable, user adoption soars, creating a virtuous cycle of better data quality, more reliable insights, and better decisions that Improve Netsuite Performance across the board.
Practical Use Cases: NetSuite Dashboards in Action
The power of NetSuite dashboards is best seen in how they are custom for different departments, providing the right information at the right time.
For the Finance Team (AP/AR/Controller)
For finance, a NetSuite dashboard is a financial control center for managing cash flow and ensuring accuracy.
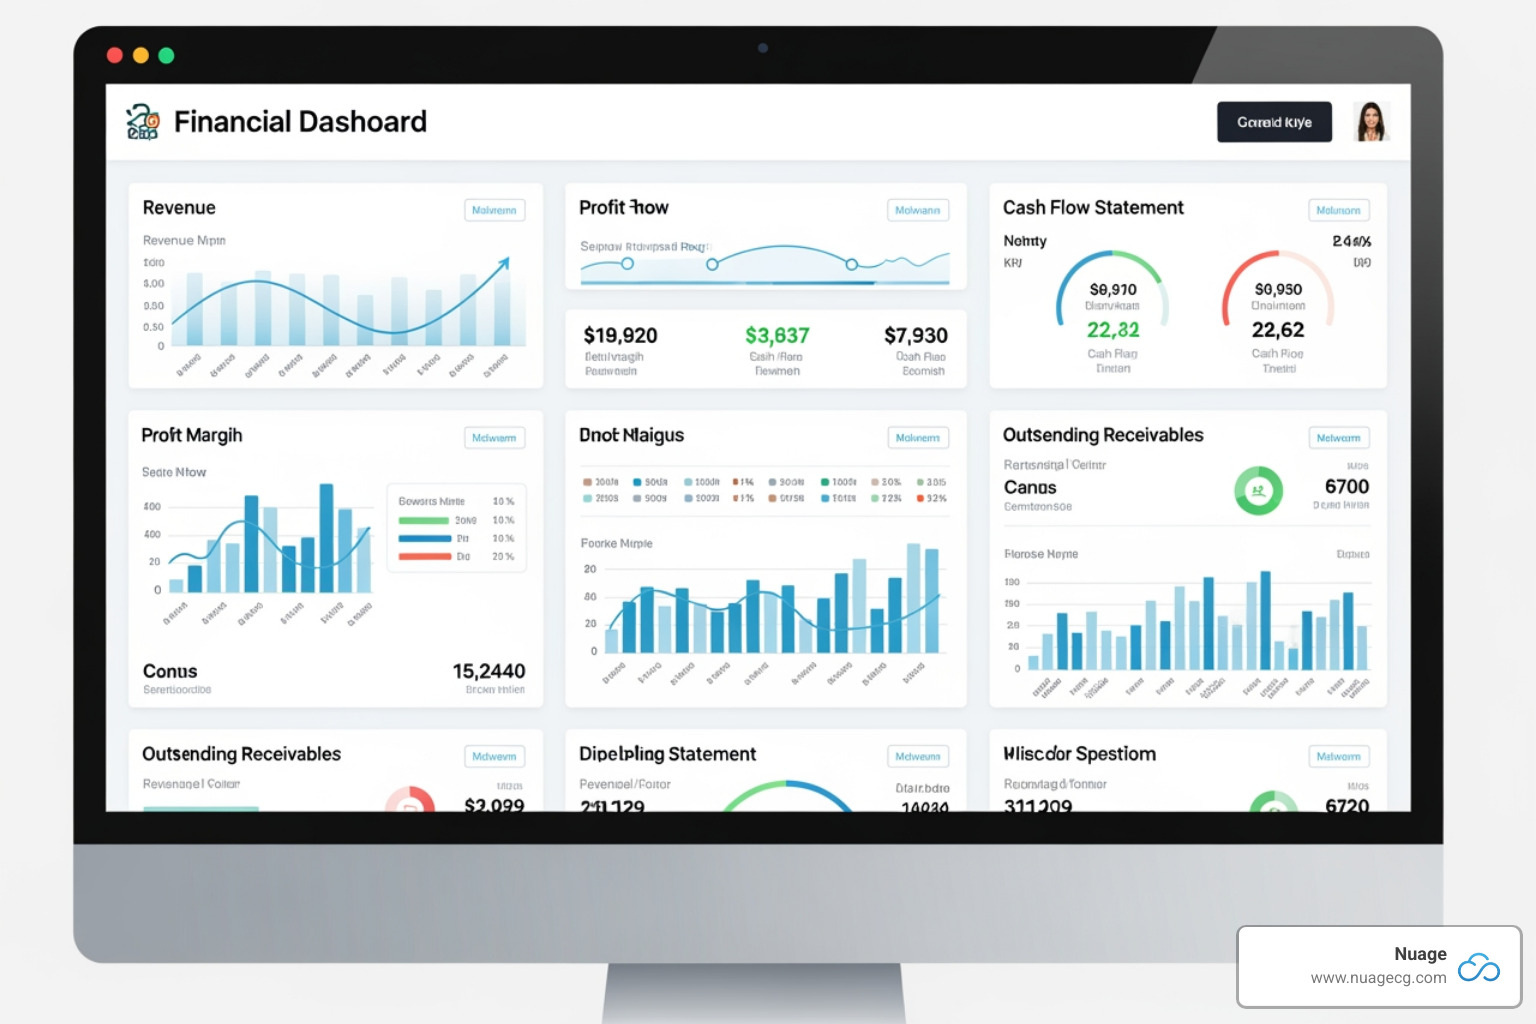
Key dashboard components for finance include:
- Reminders: Portlets for Bills to Approve and Invoices Overdue keep critical tasks visible.
- Aging Reports: A/P & A/R Aging portlets provide graphical summaries of outstanding payables and receivables, making it easy to manage working capital.
- Financial KPIs: Real-time metrics like Days Sales Outstanding (DSO), Days Payable Outstanding (DPO), Cash Flow, and Gross Profit Percentage monitor the company’s financial health.
- Report Snapshots: Quick access to high-level summaries of the Balance Sheet or Income Statement, with the ability to drill down into the Netsuite GL Detail Report for transaction-level detail.
For the Sales and CRM Teams
For sales teams, a well-configured dashboard keeps their pipeline front and center and ensures timely follow-ups. Key portlets and KPIs include:
- Opportunities to Close: Highlights deals nearing their close date that require immediate attention.
- New Leads: Ensures fresh opportunities are addressed quickly.
- Sales Pipeline Graph: A visual snapshot of pipeline health, showing opportunities organized by stage to improve forecasting.
- Sales KPIs: Metrics like Conversion Rate, Sales per Rep, Average Deal Size, and Customer Lifetime Value (CLTV) track performance and identify trends.
Many companies also use bundles like the Improved Sales Center for pre-configured portlets designed to accelerate sales. For deeper insights, you can explore strategies to Business Analytics: Integrate Netsuite and Salesforce Data. If your organization uses Salesforce, aligning CRM pipeline data with NetSuite financials amplifies dashboard value for revenue teams.
For Operations and Administration
Operations and administration teams use dashboards to monitor efficiency, logistics, and system health.
For Operations Managers:
- Inventory Levels: Highlights items below reorder points or approaching obsolescence.
- Shipments Today: A real-time view of outgoing deliveries.
- Open Purchase Orders: Visibility into pending supplier orders to manage lead times.
For System Administrators:
- Login Audit Trail: Tracks user access and failed login attempts for security monitoring.
- Script Errors: Alerts administrators to SuiteScript issues needing attention.
- Reminders: Can be configured for Failed Login Attempts or Users Not Logged In > 90 Days to manage security and licenses.
This proactive monitoring is a core part of an effective Netsuite Performance Management Guide that keeps the business running smoothly.
Best Practices for Effective Dashboard Implementation
Implementing NetSuite dashboards effectively requires strategic design and planning to ensure user adoption and real business value.
Designing with the User in Mind
The most effective dashboards are designed for the user. Follow these best practices:
- Understand the User: Before adding portlets, talk to the users. What are their daily tasks? What questions do they need answered immediately? Tailor dashboards to their specific role and center in NetSuite.
- Define Business Questions: Each dashboard should inform specific decisions. If a metric doesn’t drive action, it likely doesn’t belong on the main view.
- Keep It Simple: Avoid clutter. A dashboard with too much information is overwhelming. We recommend a maximum of 5-6 key portlets for an at-a-glance view.
- Prioritize Performance: Too many complex saved searches can slow down page load times. A slow dashboard won’t be used. Test and optimize for speed. Our guide on Netsuite Software Optimization offers more strategies.
- Use Layouts Wisely: Place the most important information at the top left. Use NetSuite’s column layouts to minimize scrolling.
- Train and Iterate: Show users how to interpret data and use drill-down features. Gather regular feedback and evolve the dashboards as business needs change.
- Leverage Existing Bundles: Don’t reinvent the wheel. SuiteApps like the Dashboard Tiles Bundle or the Improved Sales Center offer pre-configured, best-practice dashboards.
- Promote Alignment: Consider displaying company OKRs or key KPIs on dashboards to align individual efforts with broader company goals.
By following these practices, you can create dashboards that are functional, highly adopted, and transformative for your business. For more information about how NetSuite can serve as your central business platform, visit our NetSuite page.
Frequently Asked Questions about NetSuite Dashboards
Here are answers to the most common questions we receive about NetSuite dashboards.
How do NetSuite dashboards compare to other ERP/CRM dashboards?
While most modern systems offer dashboards, NetSuite dashboards stand out due to their embedded nature. The analytics are built directly into the platform, not bolted on as a separate tool.
This design provides two key advantages:
- Real-Time Data: Dashboards pull directly from NetSuite’s unified database, so you’re always looking at current information without integration lag or batch processing.
- Single Source of Truth: Everyone in the organization looks at the same data from the same source, which eliminates discrepancies and improves data trust.
Furthermore, NetSuite’s deep, role-based customization makes it simple to deliver highly personalized and scalable views for every user in your organization.
What is the cost of NetSuite’s dashboard capabilities?
Here’s the good news: NetSuite’s reporting and dashboard capabilities, including SuiteAnalytics, are included with the core NetSuite platform. They are not an extra module or a premium feature. When you subscribe to NetSuite, the powerful visualization tools that power your dashboards are part of the package, allowing you to gain insights without incurring separate BI licensing fees. For a full overview, see our Netsuite ERP Complete Guide.
Can I view my dashboard on a mobile device?
Yes. The NetSuite mobile app provides robust functionality for viewing your dashboards on a smartphone or tablet. You can check KPIs, view report snapshots, and monitor saved searches on the go. The dashboards are optimized for mobile viewing, changing them from a desktop tool into a true real-time command center that travels with you.
Conclusion: Turning Your Data into Your Greatest Asset
Your business data holds immense potential, but it’s useless without the right tools to interpret it. NetSuite dashboards transform that raw potential into clear, actionable insights that everyone in your organization can use to drive the business forward.
We’ve covered the core components, customization options, and real-world use cases for finance, sales, and operations teams. However, knowing what’s possible is different from achieving it. Many companies only scratch the surface of what their NetSuite investment can do, leaving significant value on the table.
This is the gap we bridge at Nuage. As your NetSuite Optimization Engine, we focus on making your existing system work harder for you. With over 20 years in digital change, we help businesses in Manhattan Beach, Jacksonville, and beyond configure role-specific dashboards, optimize performance, and drive user adoption.
Your data should be your greatest strategic asset. Let us help you open up its full potential.
Open up your NetSuite potential with Nuage